by Marketing | Jul 11, 2017 | News
 Incoterms® is an abbreviation for “International Commercial Terms.” This term represents a very useful way of communication and it’s actually aimed at reducing confusion between buyers and sellers.
So what is an incoterm? An incoterm represents a universal term that defines a transaction between importer and exporter so that both parties understand the tasks, costs, risks, and responsibilities, as well as the logistics and transportation management from the exit of the product to the reception by the importing country. Incoterms are all the possible ways of distributing responsibilities and obligations between two parties. It is important for the buyer and seller to pre-define the responsibilities and obligations for the transport of the goods.
Here are the main responsibilities and obligations:
- Point of delivery: here, the incoterms defines the point of change of hands from seller to buyer.
- Transportation costs: here, the incoterms define who pays for whichever transportation is required.
- Export and import formalities: here, incoterms define which party arranges for import and export formalities.
- Insurance cost: here, incoterms define who takes charge of the insurance cost.
Advantages of using incoterms:
- As they stand today, there are 11 main terms and a number of secondary terms that help buyers and sellers communicate the provisions of a contract in a clearer way; therefore, reducing the risk of misinterpretation by one of the parties.
- Incoterms govern everything from transportation costs, insurance to liabilities. They contribute to answering questions such as “When will the delivery be completed?” “What are the modalities and conditions for transportation?” and “How do you ensure one party that the other has met the established standards? Having said that, it is important to remember that there are also limits to Incoterms. For example, they do not apply to contractual rights and obligations that do not have to do with deliveries. Neither do they define solutions for breach of contract.
Here’s what you should know about incoterms:
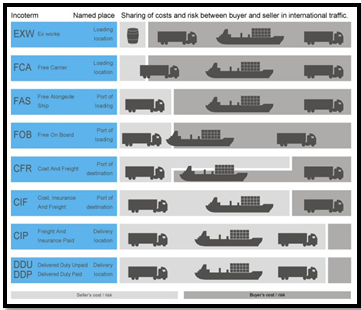
- Ex Works (EXW) – The seller makes the goods available at its location, so the buyer can take over all the transportation costs and also bears the risks of bringing the goods to their final destination.
- Free Carrier (FCA) – The seller hands over the goods into the disposal of the first carrier. After the buyer takes over all the costs, the risk passes when the goods are handed over to the first carrier.
- Free Alongside Ship (FAS) – The seller must place the goods alongside the ship at the named port, the risk of loss or damage to the goods passes when the goods are alongside the ship, and the buyer bears all the costs from that moment on.
- Free on Board (FOB) –The seller must load the goods on board of the ship, nominated by the buyer. Cost and risk are divided when the goods are actually on board.
- Cost and Freight (CFR) –Seller must pay the costs and freight to bring the goods to the port of destination. Although the risk is transferred to the buyer when the goods are loaded on the ship.
- Cost, Insurance and Freight (CIF) –It’s exactly like CFR except that the seller must in addition procure and pay for the insurance.
- Carrier and Insurance Paid to (CIP) –The seller pays for the carriage and insurance to the named destination point, but risk passes when the goods are handed over to the first carrier.
- Delivered Duty Paid (DDP) –The seller is responsible for delivering the goods to the named place in the country of the buyer, and pays all costs in bringing the goods to the destination.
You will find a handy Incoterms 2010 Quick Reference Guide on the Logistics Plus website. Additionally, you can check out our short Introduction to Incoterms 2010 Webinar online.


by Marketing | Jun 6, 2017 | News
 Shipping between the U.S. and Mexico is not as easy as it may seem. In order to transport shipments between these countries, there are certain regulations and documents that must be legally followed. The most common methods of shipping goods from the United States to Mexico are by truck, rail, air and sea, or a mixture of two or more of these transportation modes.
Here’s what you need to know when you’re shipping from the U.S. to Mexico:
- An American carrier will transport your cargo to the border and deliver it to the designated carrier who has been selected / hired by the Mexican consignee (the recipient of his goods).
- The carrier receives your shipment, inspects the cargo, checks all documents and prepares the shipment to enter Mexico on behalf of the Mexican customs agent who is handling your shipment.
- The Mexican customs agent will formally present the Mexican customs entry on behalf of the Mexican consignee.
- Now it’s time for your cargo to cross the border! A third party transportation company will ship your shipment across the border, through customs, and then deliver it to the selected Mexican carrier’s facility.
- Finally, the Mexican carrier transports its cargo inland to its final destination in Mexico, the consignee
Here’s what you need to know when you’re shipping from Mexico to the U.S:
- A Mexican carrier transports its cargo to the border city.
- A Mexican customs agent formally presents the entry of the Mexican export customs on behalf of the Mexican sender so that the goods can legally leave the country.
- A licensed U.S. customs agent then files the U.S. customs clearance so that the shipment can enter the U.S. on behalf of the U.S. importer of record (the consignee).
- A third party transportation company will ship your shipment across the border, through the U.S. Customs, and deliver the shipment to the selected U.S. carrier’s premises.
- The U.S. carrier transports the freight to the final destination.
Here are the basic import and export documents you’ll need:
- Import /export form
- Commercial invoice
- Bill of lading
- NAFTA Certificate of Origin (only if goods qualify for NAFTA)
Every country has its own regulations and shipping requirements so it’s important to be aware of this information before shipping to any country. Contact our team of cross-border experts here at Logistics Plus to learn more about shipping between the U.S and Mexico.


by logisticsplus | Apr 13, 2017 | News
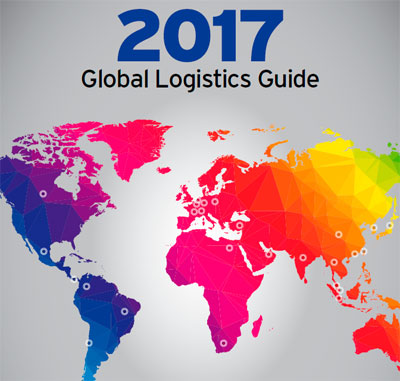
 The folks at Inbound Logistics magazine published their 13th annual Global Logistics Guide in the March 2017 issue. You can also read the full report online. As part of the report, Inbound Logistics ranks major foreign countries according to the following criteria:
- Transportation infrastructure (T)
- IT competency (I);
- Business culture (B); and
- Intangibles (X).
For your benefit, we have summarized the Inbound Logistics rankings below (10 is the highest score and 3 is the lowest):
| Region |
Country |
Overall |
T |
I |
B |
X |
| Europe |
Netherlands |
10 |
4 |
3 |
3 |
0 |
| Europe |
Germany |
9 |
4 |
3 |
2 |
0 |
| ME/Africa |
UAE |
9 |
4 |
2 |
2 |
1 |
| SE Asia/India |
Singapore |
9 |
4 |
3 |
2 |
0 |
| Europe |
Switzerland |
8 |
3 |
3 |
2 |
0 |
| Asia |
Hong Kong |
8 |
3 |
3 |
2 |
0 |
| Asia |
Japan |
8 |
3 |
3 |
2 |
0 |
| Americas |
Canada |
7 |
2 |
3 |
3 |
-1 |
| Americas |
Panama |
7 |
3 |
1 |
2 |
1 |
| Europe |
France |
7 |
3 |
2 |
2 |
0 |
| Europe |
Belgium |
7 |
3 |
2 |
2 |
0 |
| SE Asia/India |
Malaysia |
7 |
3 |
2 |
2 |
0 |
| SE Asia/India |
India |
7 |
2 |
1 |
2 |
2 |
| SE Asia/India |
Taiwan |
7 |
3 |
3 |
2 |
-1 |
| Asia |
South Korea |
7 |
3 |
3 |
2 |
-1 |
| Americas |
Chile |
6 |
2 |
2 |
2 |
0 |
| Europe |
Poland |
6 |
2 |
1 |
2 |
1 |
| Asia |
China |
6 |
3 |
1 |
2 |
0 |
| Americas |
Colombia |
5 |
2 |
1 |
2 |
0 |
| Americas |
Mexico |
4 |
2 |
1 |
2 |
-1 |
| Europe |
Russia |
4 |
2 |
1 |
1 |
0 |
| SE Asia/India |
Indonesia |
4 |
2 |
1 |
1 |
0 |
| SE Asia/India |
Thailand |
4 |
2 |
1 |
1 |
0 |
| Asia |
Vietnam |
4 |
2 |
1 |
1 |
0 |
| Americas |
Brazil |
3 |
2 |
1 |
1 |
-1 |
| Europe |
Turkey |
3 |
2 |
1 |
1 |
-1 |
| ME/Africa |
South Africa |
3 |
2 |
1 |
1 |
-1 |
The good news is that if you are exporting to, or importing from, any of these countries, Logistics Plus has local offices or reliable agents in almost every one of these countries. So we can help you with affordable import/export transportation rates and customs clearance fees; we can help you with warehousing and distribution solutions if they’re needed; and we can help you address virtually any global trade compliance issue that might apply. If you do business in any of these countries, we invite you to contact us to learn more.


by logisticsplus | Mar 7, 2017 | News
 Overview. 2016 business reports show that U.S. exporters exported $2.2 trillion worth of goods and services. This was about 12% of total economic output in GDP terms. Keep in mind that only 1% of American businesses export their products. Based on the report, the U.S. is the 3rd largest exporter in the world right behind China and the EU, with Germany coming in at fourth place. This is a slight drop in total U.S. market share both in actual terms and as a percentage of global exports. Most of America’s exports are goods as well as service sector based products. The intangible nature of services makes them harder to export across countries and regions.
Top U.S. Exports
$1.46 of the $2.21 trillion exported items comprised of goods and items. This means two-thirds of what America exported were commodities. The products fall into seven categories. These are capital goods, industrial supplies & equipment, consumer goods, automobiles, agricultural products, and services.
- Capital Goods. A little over $500 billion worth of capital goods were exported mostly from 6 broad categories. These are Industrial machines ($51 billion), Commercial Aircraft ($121 billion), and Medical equipment ($35 billion). The others are telecommunications ($41 billion), semiconductors ($44 billion), and Electric apparatus ($42 billion).
- Industrial supplies and equipment. In 2016 the U.S. exported $398 billion worth of materials used. Most of these are oil and oil-based products. Chemicals topped the list followed by fuel oil, then petroleum products, and plastic. Non-monetary gold closed this list at $20 billion.
- Consumer goods. These constitutes 13% of the goods exported valued at about $200 billion. The breakdown is pharmaceuticals ($53 billion), cell phones ($24 billion) and gem diamonds ($21 billion). Consumer spending is influenced by disposable income, income per capita, living wage, household debt, consumer expectations and inflation rates
- Automobiles. These constitute 10% of the exported goods and services averaging about $150 billion. GM, Chrysler, and Ford are the largest cars manufacturers. There are a few smaller ones also in the market. The output has been growing significantly after taking a dip during the 2008 financial crisis.
- Agricultural products. At $131 billion this is one of the largest products exported from the U.S. markets. They tend to be generally cheaper since they receive lots of government subsidies. Bioengineering and chemical additives have helped to boost production and supply of agricultural products. Soybeans ($24B), Meat and poultry ($17B) and Corn ($11B) are the top three exported goods.
- Services. This constitutes one-third of U.S. export to global markets. It totals about $750 billion. Most of the exported services in the exported commodities and items. The largest service export is aircraft services ($293B), Computer & Related services ($178B), Intellectual property and royalties ($120B) and banking ($113B) as well as defense ($20B).
Challenges Facing the United States Exporting Sector
The United States export market has shrunk globally due to the emergence of developing industrial economies like Brazil, India, China, and Indonesia. These countries have developed industrial units that manufacture most of the goods for the local market which in turn lowers demand for American products.
- Secondly is standards of living. These countries have lower standards of living. This allows them to produce goods at a cheaper rate. The lower standards of living enable them to erode America’s competitive and comparative advantages across lots of industries. When it comes to automobiles Japanese, and European car makers producers better quality and cheaper cars that are well suited for global markets.
- Third, is the issue of oil. America is both a huge producer and importer of oil. That’s because they produce a lot yet their demand is even hired. Keep in mind that some of the oil that they produce does not meet their consumption standards, so they export it to Africa. Most of the oil produced is shale oil. America therefore still spends much more on buying oil abroad.
- American Trade Deficit. American trade deficit as of 2016 stood at $500 billion. We imported $2.7 trillion worth of goods and services while exporting $2.2 trillion. This is about $25 billion higher than 2013. This can mostly be attributed to the strengthening of the dollar by 25% between 2013 and 2016. Even then this deficit is $200 billion less than 2006 meaning, the value is on a general upward trend. The primary drivers of this deficit are consumer products (-$397B) and automobile (-200B) deficit.
- The deficit with Major Trading Partners. America’s top trading partners are China ($580B), Canada ($545), Mexico ($525B). The deficit with China stands at about $347B making them responsible for 70% of our deficit. This deficit significantly weakens the economy since the economy ends up being financed by debt which has to be paid back with interest. The dollar is said to have declined 40% between 2001 and 2007. This in turn weakness America’s competitiveness on the global stage.
Opportunities for U.S. Exporters
Despite the challenges, it’s not all gloom and doom. America has certain old and emerging opportunities on the export front. The U.S. exported $2.209 trillion worth of exports in 2016. America has a lot of potential given that this constitutes export from
1% of American firms only.
- The U.S. Dollar Is King. American competitiveness is still pegged on the good fortune of having the dollar as the world reserve currency. This minimizes the shocks that the economy might have to take in the short and medium term. The dollar still accounted for 62% of global bank reserves still ahead of the pond, Euro, Yen, and Yuan. This I good news for small time exporters in the market.
- African Renaissance. The growth and rise of African economies have created a middle class (est. 15% of pop) that has an increasing demand for American goods. Any small or medium-sized exporter who targets this market will greatly benefit. The purchasing power of African consumers haves been on a general upward trend over the past 15 years. Economies of Kenya, Nigeria, South Africa, Ethiopia, Egypt, and Congo continue to prove versatile in the face of internal challenges and shocks. They also have massive infrastructural spending that lifts the nation’s ease of doing business.
- Investors and Technology. The U.S. continues to lead as the most attractive market for investors especially from the developing Asian economies. That’s why the U.S. continues to get hundreds of billions in capital inflows. The Foreign Direct Investment inflows stood at $736B in 2016. That accounts for 15% of the global totals or $1 in every $6. Additionally, people still flock to the U.S. as tech innovators and inventors. It’s still the home to major social players and towers in spending levels.
Ready to start exporting? Have questions or need a reliable logistics partner? The export specialists at Logistics Plus are ready to help.


by logisticsplus | Jan 31, 2017 | News
Each year, U.S. companies export well over 2 trillion dollars of goods and services. If you want your business to get in on the action, it’s important to figure out the best way to expand to new markets. The U.S. Commercial Service has developed some exporting resources and a comprehensive video collection to help small and medium businesses become better equipped to enter the world of exporting. The first video in the series is shown below.
With over 20 years of exporting expertise as a full-service international forwarding and logistics company, Logistics Plus provides exporters with a variety of global trade solutions, including:
- International Air Exporting
- International Ocean Exporting
- Amazon Global Selling
- Project Cargo Exporting
- Customs Brokerage
- Global Trade Compliance Consulting
- Global Sourcing Support
- Global Financing Solutions
- Cargo Insurance
- Linguistic Solutions
Additionally, we have a variety of tips and resources available in the News & Notes section of our website. Simply click the image below to view a collection of all our export-related articles.

Of course, to really experience our “Passion for Excellence,” feel free to contact us directly using the button below, or by emailing quotes@logisticsplus.com. We’d love to help you with any or all of your exporting needs!


 Incoterms® is an abbreviation for “International Commercial Terms.” This term represents a very useful way of communication and it’s actually aimed at reducing confusion between buyers and sellers.


