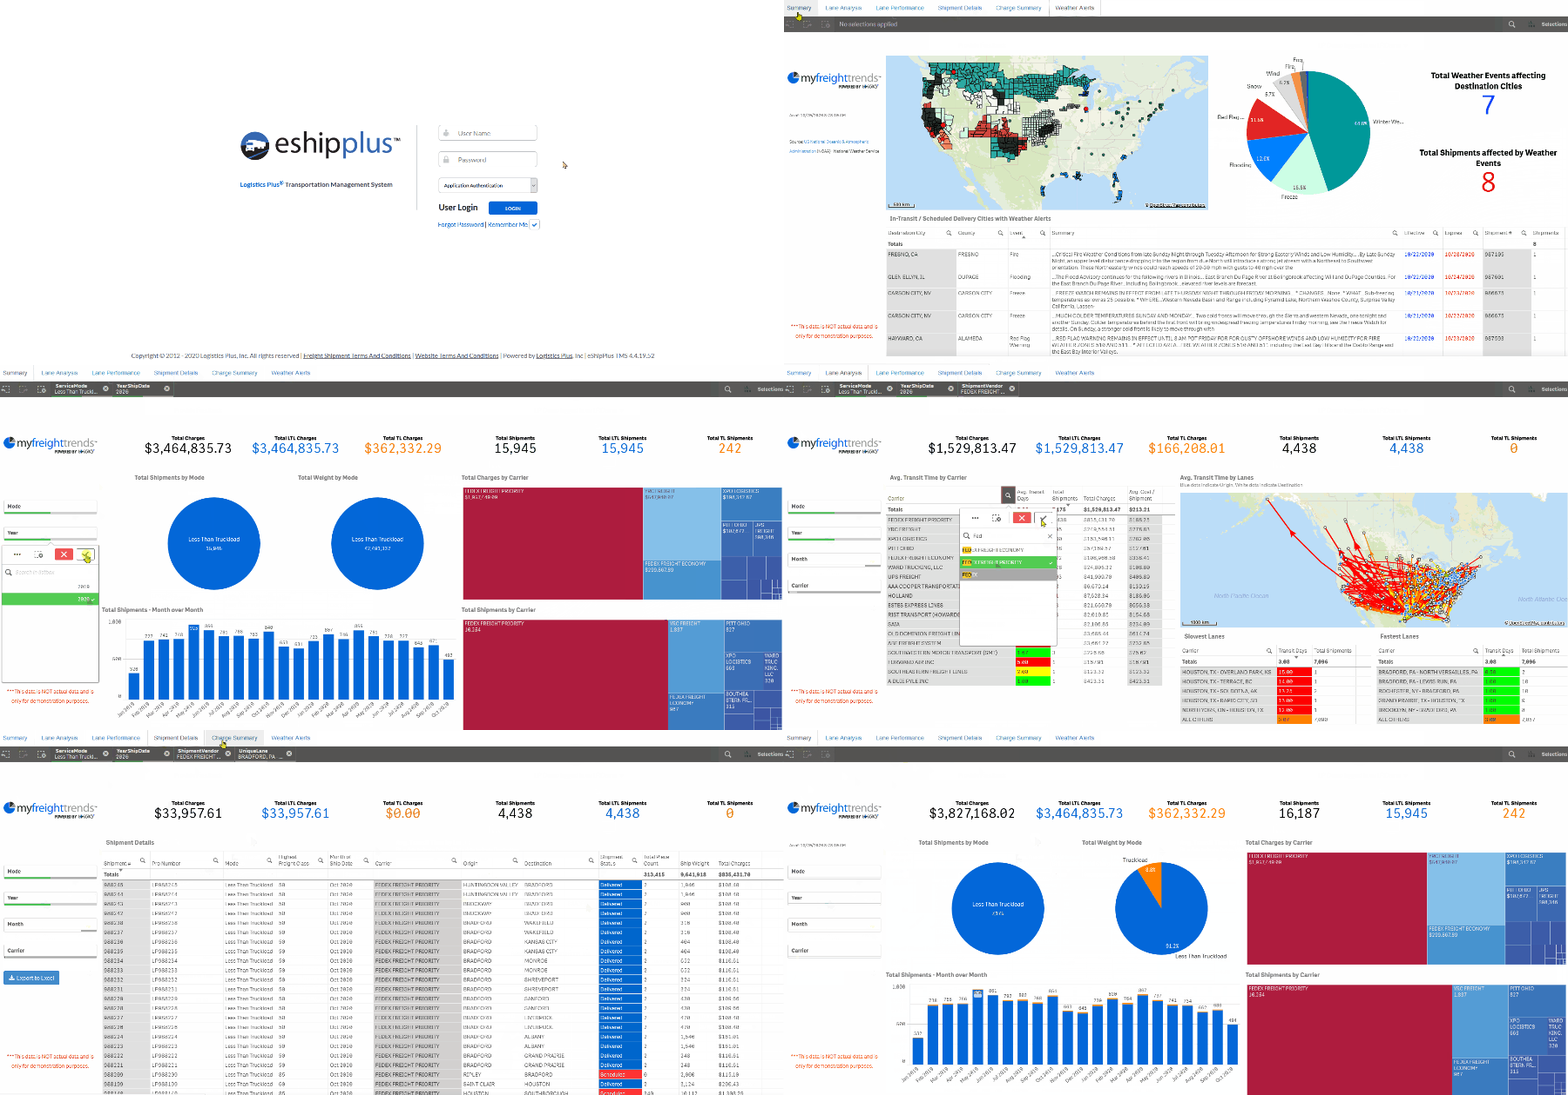
 Logistics Plus is proud to announce that a new business intelligence tool called MyFreightTrends ™ has been embedded inside its cloud-based eShipPlus ™ transportation management system (TMS). The new tool is now universally available to all eShipPlus users. The off-the-shelf report provides customers with detailed dashboards and analytics regarding their North American freight shipping, including:
- A Summary report with total LTL and FTL spend by mode and by carrier;
- A detailed Lane Analysis report with network velocity metrics;
- A Lane Performance report with average shipment cost trends by location;
- A Shipment Details report that can be exported to Excel;
- A freight Charges Summary report with historical trending; and
- A Weather Alerts map detailing weather events that may impact domestic supply chains.
All the dashboard reports are highly interactive, meaning users can click on graphs and images to instantly filter views based on modes, carriers, lanes, and timeframe.
Watch the animated GIF below for a short preview.
![]()

![]()
Watch this 9-minute tutorial.
![]()
“Logistics Plus has been on the cutting-edge of business intelligence reporting the past few years, with highly customized reports for both our internal users and our larger 3PL and 4PL clients,” said Scott Frederick, vice president of marketing & LTL carrier relations for Logistics Plus. “With MyFreightTrends, we now have a very detailed and insightful off-the-shelf package we can make available to all of our customers, no matter how small or large.” Frederick added, “Of course, we can still provide additional report customizations for clients that need them as part of our overall business intelligence solution.”
Current users can log in to eShipPlus and view the MyFreightTrends dashboards under the reporting menu. Not a current eShipPlus user? Visit www.logisticsplus.com/tools/eshipplus/about/ to learn more.

